Happy Thanksgiving! In this post, Project Director Marielle Matthews is ravenous for Census data.
I’ve always been captivated by Census data. Attempting to count every person everywhere in the United States and Puerto Rico?! That’s daunting.
Even though carrying out such a massive data collection project is an impressive feat, Census data can be—let’s face it—a bit dry. But make it about YOU, your neighbors, and your community, and suddenly it’s a lot more useful.
Census with a capital C refers to that giant effort by our government to count all the people. At Counter Tools, we often work with our clients to do a census of a different type, with a lower case c, a census of retailers. If you’ve done one of these, you know doing a census reveals a lot more than just how many retailers are in a community and where they’re located. We see patterns. Exploring Census data about your community can be similarly illuminating.
Perhaps you’ve lived in the same place for a long time and feel like you really know your community. Or maybe you move around frequently and are constantly getting to know new communities. Wherever you fall in the spectrum of “been there, understand that,” data can help us check our assumptions. I’ve lived in five states and am one of those people who’s constantly getting to know new communities. I enjoy getting to know my community of people AND getting to know my community as a population. Did you know I was going to mention populations? You’ve got me pegged—we’re a public health nonprofit, of course I’m going to talk about population!
Like many data nerds, I enjoy looking at some popular variables and comparing them across my current and former communities, answering the question, “how much do these communities differ at the population level?” Some interesting variables to look at include population size, race and ethnicity, percent of the population under 18, median income, and percent below the federal poverty level, among a host of other useful data obtained from the Census.

A census is not only logistically daunting, but also expensive. When we can’t do a census, we do a sample and extrapolate. The American Community Survey, ACS, provides estimates between Census years. Here are a few interesting tidbits from the 2016 ACS:
Median household income was $55,322.
Median family income was $67,871.
Median per capita income was $29,829.
Government workers made up about 14% of the workforce.
Private sector workers made up about 80% of the workforce.
Of people who commuted to work, 2.8% walked.
Of people who commuted to work, 5.1% took public transportation.
Of people who commuted to work, 9.3% carpooled.
Do those tidbits make you feel reflective? They sure do for me! Especially as we approach our most neighborly holiday of Thanksgiving, I find myself thinking about my neighbors, our community, our collective data points, and the stories we tell with our data.
Here are some ways to use data (from the Census and/or other sources) to understand yourself, your neighbors, and your community better this month:
- Wikipedia that! Search for your community in Wikipedia. Wikipedia often incorporates Census data and is a great starting point to understand your community demographics. Interesting tidbits that I find myself reflecting on are population size, median household income, median per capita income, race and ethnicity demographics, median age, and percent in poverty.
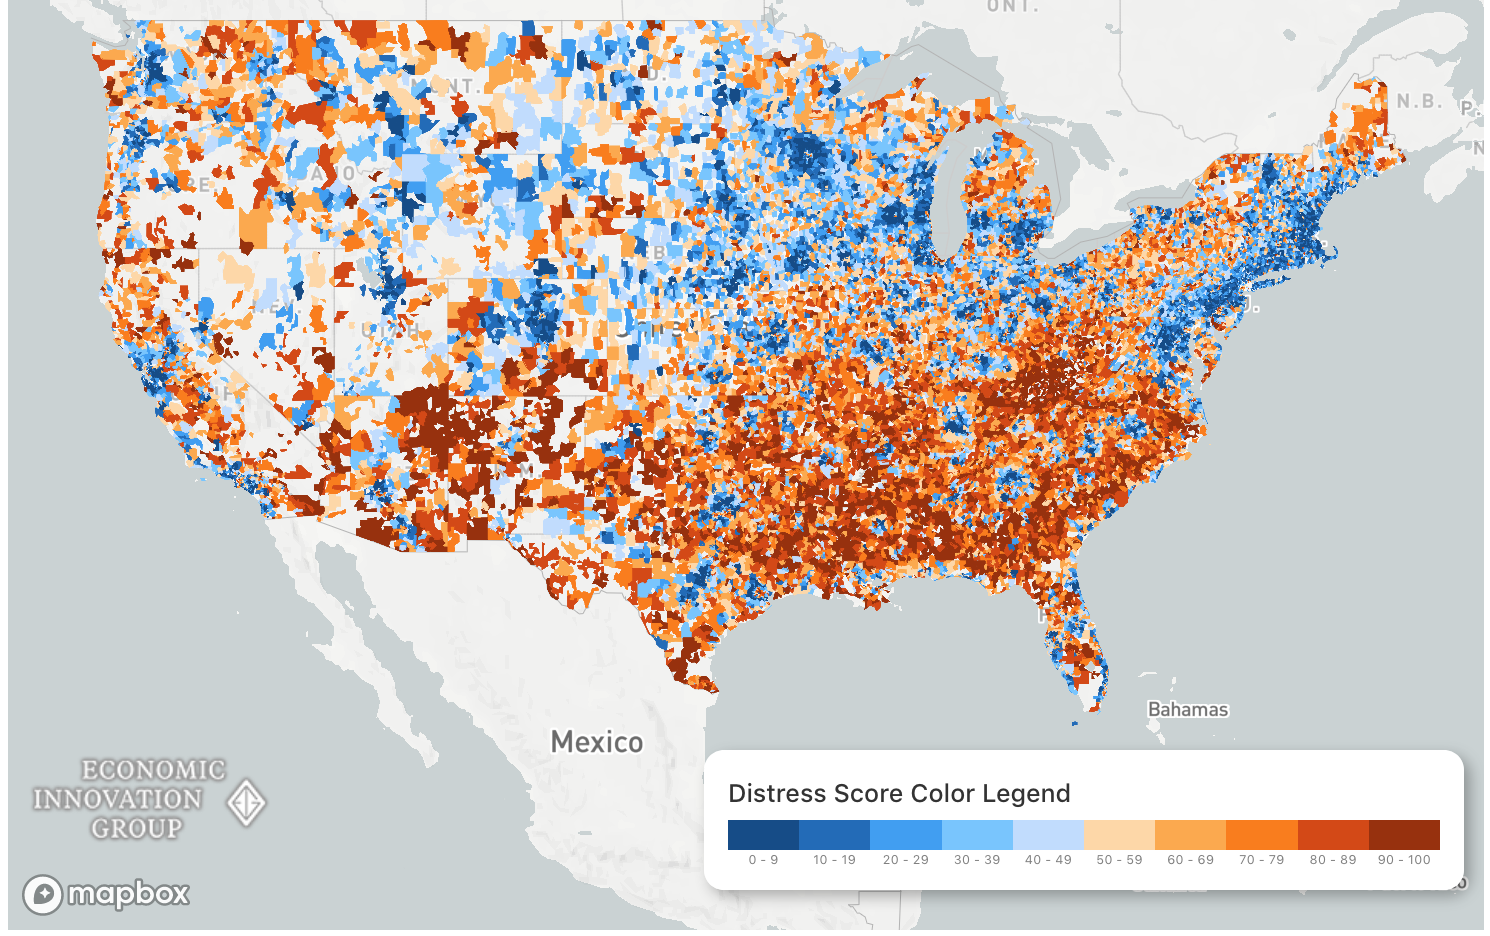
- Use Maps! If you work with Counter Tools software products, you know that WE LOVE MAPS. Mapping variables can really affect the way that we understand data. Some really interesting data maps that I’ve been exploring recently are the Distressed Communities Index from the Economic Innovation Group and ProPublica’s Miseducation tool.
- Take a Census dive! Explore factfinder.census.gov. Start simple: type in your community to search and go. If these numbers are overwhelming, try the America Counts series, which synthesizes data into stories that are relevant and understandable. No spreadsheets required!
I hope that whatever data you choose to explore, you enjoy the process. Census data can be dry, but the stories they can tell don’t have to be! Happy learning and happy holidays.