The overall racial and ethnic diversity of the country has increased since 2010, and the number of people who identify as multiracial increased significantly. We use census data in our data collection and mapping tools to help states identify disparities in tobacco and alcohol retailer density and advertising.
The Census Bureau has released data summary files from the 2020 census that show population changes as the nation becomes more racially and ethnically diverse.
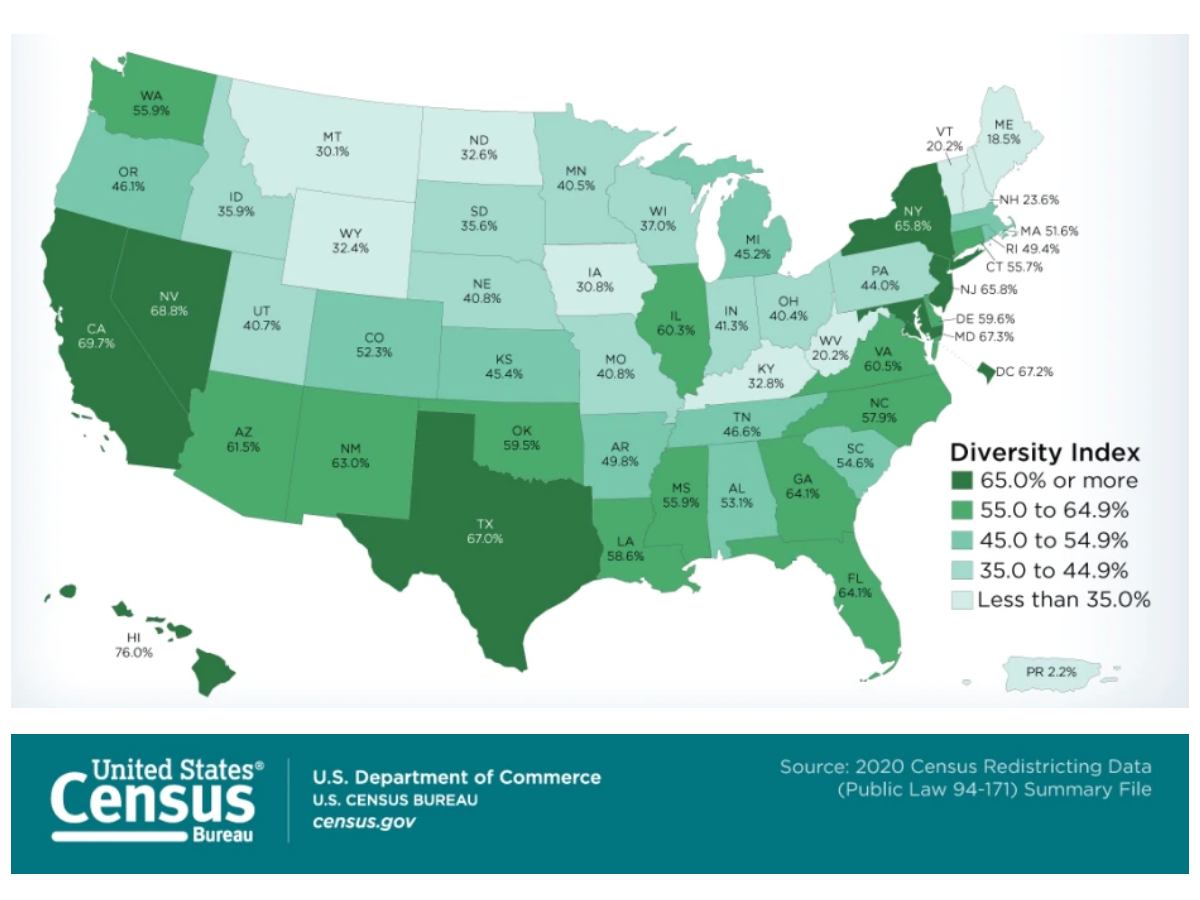
The Census Bureau has provided an interactive map viewer as well as helpful data visualizations to explore population sizes, racial and ethnic diversity, housing data, and more.
The overall racial and ethnic diversity of the country has increased since 2010. The Hispanic or Latino population grew by 23%, the Asian alone population by 35%, and the Black population by 5.6%. The number of people who identify as multiracial (two or more races) increased by 276%. The White alone population declined by 8.6%.
The Census Bureau updated the race question in 2020 by allowing respondents to write additional details about their race, so someone who selected “Black” could also write “African American” or “Jamaican.” New codes were added while analyzing the data to account for a wider variety of how people self-identify.
The significant changes in race and ethnicity is clearly a sign that our country is becoming more diverse. It may also be partially explained by the way we talk about race and ethnicity. There is less stigma around being multiracial, and younger people may be more open to describing themselves as multiracial. Some people who chose White only on the 2010 census may have felt more comfortable choosing multiple races in 2020. As DNA testing becomes more popular, it may also be changing the way people think about themselves. A Stanford study found that people who have taken ancestry tests are more likely to identify as multiracial.
The census is taken every 10 years to count the number of residents in each county. Census data is used primarily to determine the distribution of Congressional seats and define districts, but it is also used to help determine how to distribute billions of dollars in federal funding to support public health initiatives, build roads and schools, improve transportation, and more.
At Counter Tools, we use census data in our data collection and mapping tools to help states identify disparities in tobacco and alcohol retailer density and advertising. Evidence shows there are more tobacco outlets in communities with higher Black and Hispanic populations. Just as these industries use census data to target their marketing and product availability, those who work in public health can use it to keep an eye on disparities and inform policy decisions.
The data summary files can be downloaded here and the complete data toolkit will be available by Sept. 30, 2021.