Project Description
The Geographic Health Equity Alliance (GHEA) and Counter Tools partnered to create the Geographic Surveillance Learning Collaborative for National Tobacco Control Programs and National Comprehensive Cancer Control. The primary objective of this collaborative was to build the capacity of state programs to conduct surveillance of tobacco policies in a format that adheres to the methods and principles of the field of policy surveillance. Seven states participated in the Year 1 Collaborative and shared how they used geographic surveillance to support program planning, identify health disparities and improve communication strategies and policy efforts.
The Geographic Health Equity Alliance (GHEA) and Counter Tools facilitated the inaugural Geographic Surveillance Learning Collaborative for National Tobacco Control Programs and National Comprehensive Cancer Control from May to September 2020. In order to participate, interested states were required to establish a three-person team consisting of a statewide representative from each of the following fields: (1) tobacco control, (2) comprehensive cancer control and (3) epidemiology or related field that handles the development of statewide geospatial tools.
Six states participated in the Year 1 Collaborative: Alaska, Florida, Georgia, Indiana, Iowa, and Wisconsin. Each team was responsible for collaborating across departments (tobacco control, comprehensive cancer and epidemiology) to create a presentation highlighting examples of their use of geographic surveillance systems. Teams shared how they used geographic surveillance to support program planning, identify health disparities and improve communication strategies and policy efforts. Along with presentations from participating states, each monthly collaborative session featured dedicated time for questions and peer-to-peer networking. The Year 1 Collaborative also included two presentations from national experts representing the Policy Surveillance Program at the Center for Public Health Law Research and the Center for Disease Control’s U.S. Cancer Statistics.
Geographic Surveillance in Tobacco Control Programs
Participants in our inaugural Geographic Surveillance Learning Collaborative demonstrated a variety of ways geosurveillance was incorporated into their tobacco control programs. From visualizing tobacco retailer data to mapping tobacco-free policies, tobacco control programs have found unique ways to visualize different types of tobacco data. Below are a few examples of these strategies:
The Geographic Health Equity Alliance (GHEA) is a CADCA initiative. GHEA is a CDC funded National Network dedicated to reducing geographic health disparities related to tobacco and cancer.
Alaska
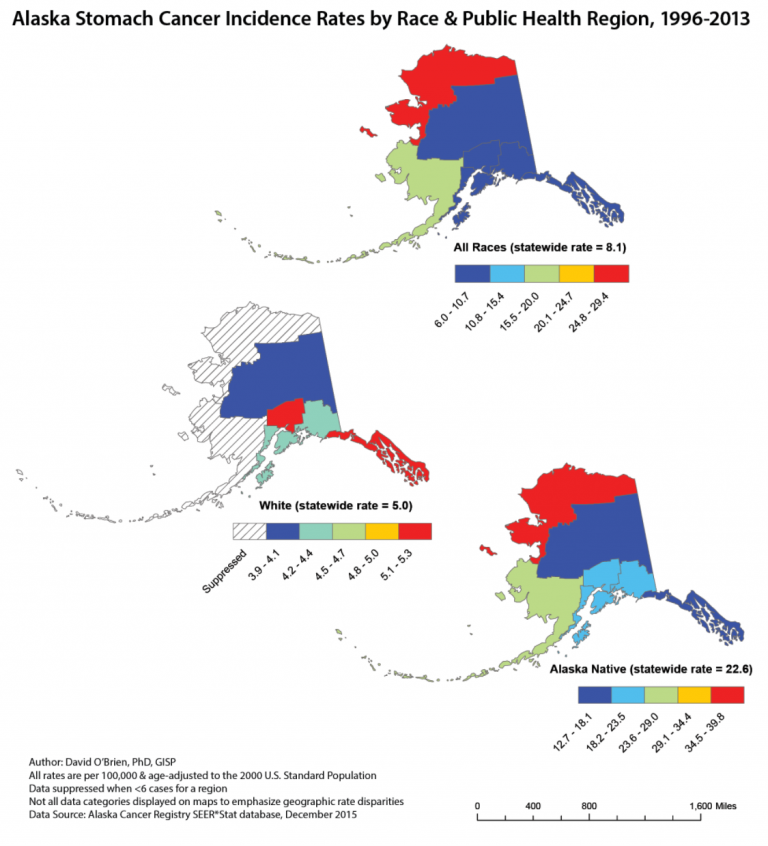
As the most sparsely populated state in the United States, one of Alaska’s primary challenges is finding ways to utilize data in a meaningful way despite small numbers. Because of this, Alaska’s Division of Public Health’s Cancer Control Program often has to stratify by region (rather than the city or county level) and has to combine multiple years of data to allow for comparison among groups. The Alaska Cancer Registry used stratification by Public Health Regions to develop a geospatial analysis of several cancers of interest, including stomach cancer.
Alaska has the 9th highest incidence of stomach cancer in the United States, with an average of about eight cases per 100,000 population, compared to an average of six cases per 100,000 for the U.S. as a whole. When examining stomach cancer incidence for the entire state of Alaska, there are large variations in rates, ranging from six to 29 cases per 100,000. However, a closer look at the data stratified by Alaska’s two largest race groups, White and Alaska Native, illustrates that the varied rate can likely be attributed to the geographic distribution of the Alaska Native population.
These maps highlight a clear health disparity in Alaska, and one that often persists across other types of cancer. The purpose of these types of maps is primarily to educate public health audiences, helping to inform resource and intervention distribution as well as assisting in evaluation efforts.
Florida
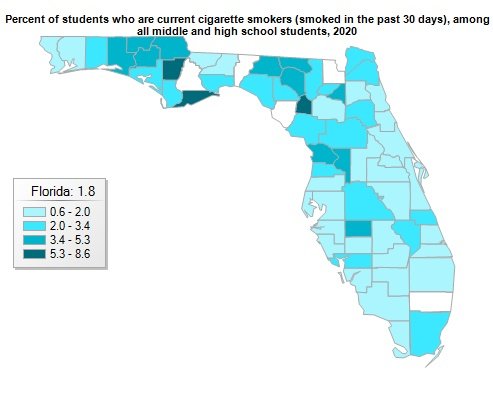
The Florida Community Health Assessment Resource Tool, known as Florida CHARTS, is a website managed by the Division of Public Health Statistics and Performance Management at the Florida Department of Health. The tool incorporates a number of data sources to create reports and maps on a wide variety of topics.
For the purpose of the Geographic Surveillance Learning Collaborative, participants were specifically interested in the use of the Florida Youth Tobacco Survey (FYTS) and the Florida Behavioral Risk Factor Surveillance System (BRFSS) as data sources for tobacco use and exposure as well as cancer prevalence and screening indicators. Each year, in collaboration with the programs that collect the data, these indicators are updated with the newest available data.
With Florida CHARTS, users are able to stratify data by indicators including county, race, sex and ethnicity. The data can also be exported as an Excel file. The State Department of Health has found Florida CHARTS to be an extremely helpful tool for local health departments interested in utilizing FYTS and BRFSS data.
Georgia
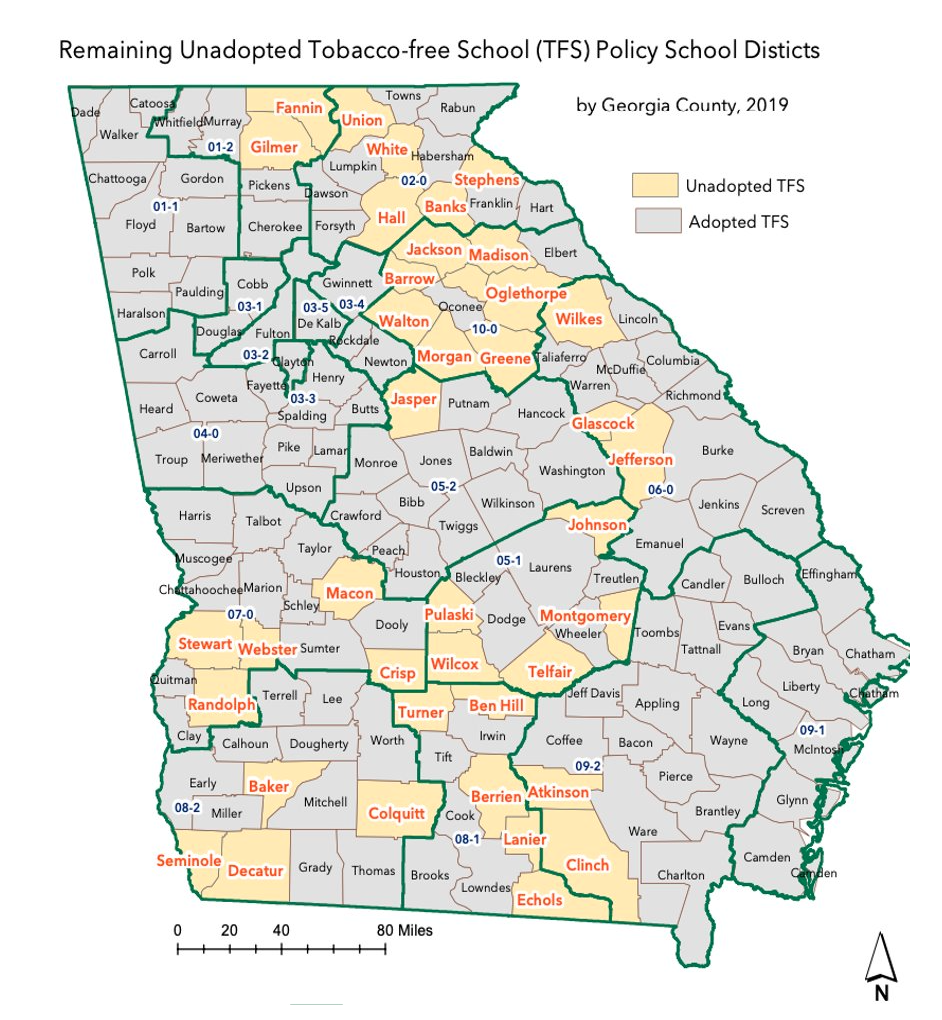
The Georgia Tobacco Use Prevention Program utilizes policy surveillance as a tool for planning, tracking and communicating about school districts that adopt 100% tobacco-free policies. Using a model policy template from the American Nonsmokers Rights Foundation, Georgia coded 13 items to ensure district policies aligned with the 100% tobacco-free model policy. This model policy requires language prohibiting the use of any type of tobacco, including e-cigarettes, for students, staff, faculty and visitors at all times of day and in all facilities. School districts that have not yet met all requirements of the model policy are identified in yellow on the map.
Indiana
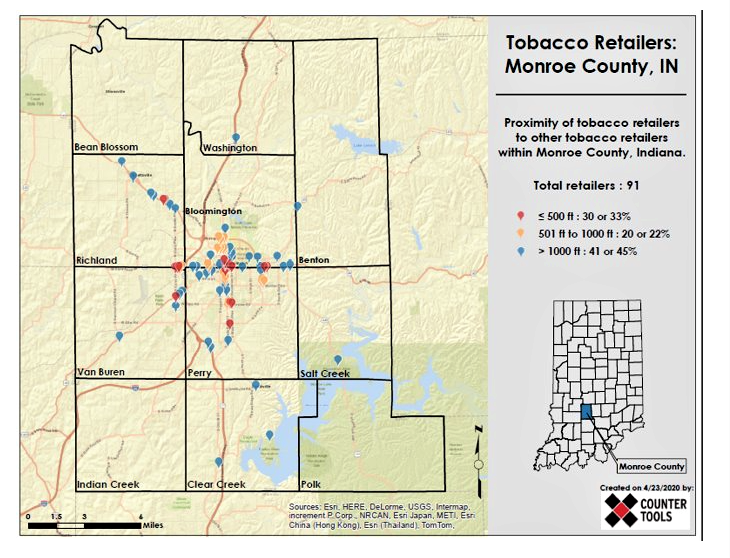
The Indiana Department of Health’s Tobacco Control Program uses mapping to understand tobacco retailer density and proximity in Indiana. Using the Standardized Tobacco Assessment for Retail Settings (STARS), Indiana collects data on product availability, pricing, promotion and placement. This data is used to create infographics about tobacco marketing personalized for each of their 43 funded counties.
Additionally, through a contract with Counter Tools, Indiana used their data to create static retailer maps for funded counties. These maps show retailer proximity to other retailers at the county-level. The maps provide a snapshot of retailer locations that is often useful for presentations by community partners. More specifically, these maps are frequently used in meetings within the school setting to guide conversations about youth targeting practices.
Iowa
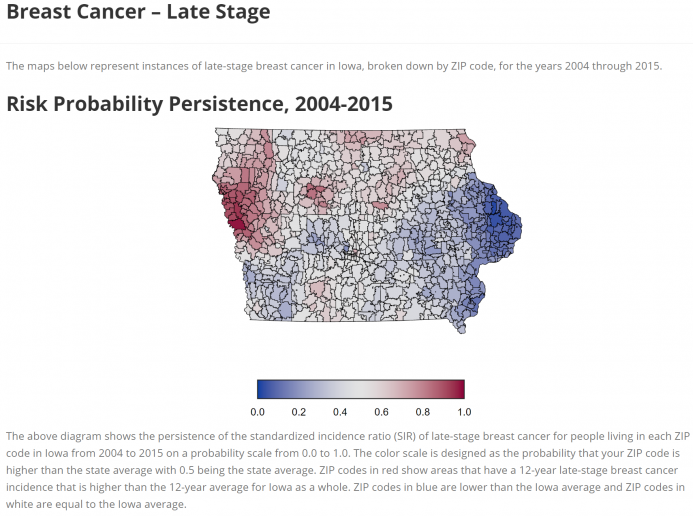
In Iowa’s Comprehensive Cancer Control Program, a series of maps depicting eight different types of cancer helps to illustrate where risk for developing or dying from certain cancers is highest, and shows trends over time. These maps were created through a contract with the University of Iowa Center for Public Health Statistics (CPHS). They are used to guide cancer prevention and control activities across the state.
The maps illustrate incidence rate, late-stage incidence rate, mortality rate and persistence for specific cancer types selected based on their frequency and the potential for prevention or screening initiatives to affect incidence or mortality. Because of the small, primarily rural population of Iowa, the CPHS used statistical smoothing methods to create estimates for each of the 935 zip codes in an effort to prevent artificial spikes.
The maps are publicly available online and allow users to click on a specific zip code for detailed information. In addition, the maps have been used by the Iowa Department of Public Health and their partners to determine allocation of resources and plan targeted interventions for areas that face disparities in cancer risk.
Wisconsin
The Wisconsin Cancer Collaborative (WCC), Wisconsin’s comprehensive cancer control program and coalition, is actively using mapping features to inform their program direction. One of their key sources for maps and data is the Wisconsin Cancer Reporting System, maintained by the Wisconsin Department of Health Services. The Wisconsin Cancer Reporting System is a population-based registry that reports occurrences of new cancers and mortality rates, as well as analyzing and sharing data for all communities in the state. Based on this available data, the WCC is able to identify areas experiencing higher rates of cancer and poorer cancer outcomes in order to direct resources appropriately. This data also assists in identifying health inequities that guide program planning.
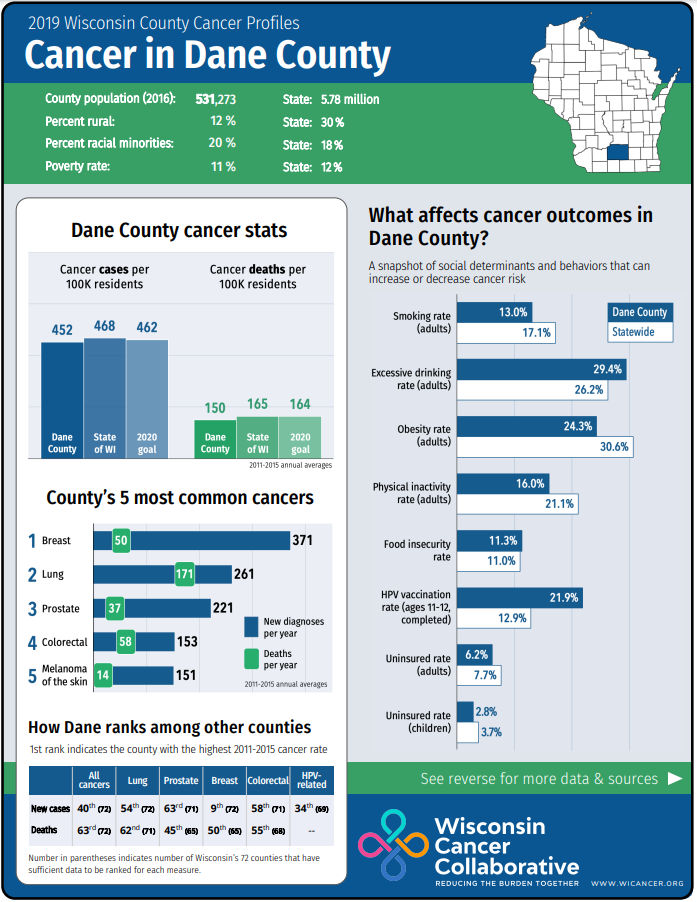
One of the ways the WCC communicates data to their Cancer Collaborative members is through their County Cancer Profiles. The County Cancer Profiles are visually appealing one-page documents with individualized infographics and data points obtained from the Wisconsin Cancer Reporting System and several other data sources. The front of the one-pager depicts county-specific cancer statistics and illustrates social determinants and behaviors that influence cancer risk. The reverse side provides state-level rates for comparison purposes. These County Cancer Profiles have been effective in raising public awareness, promoting thoughtful discussion, supporting evidence-based interventions and influencing strategic planning. The profiles are also provided to community leaders and elected officials to advocate for funding and policy support.
Stay tuned for details on the Year 2 collaborative.
Published March 10, 2021